Monthly Crime and Policing Brief
Spring Valley Crime and Policing Report, April 2026
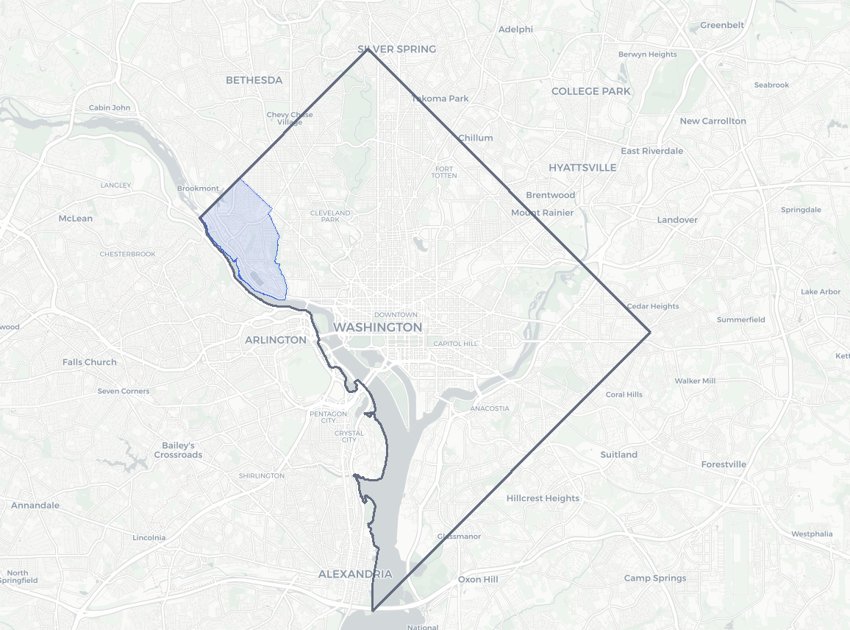
9 reported incidents · Washington, DC · Source: DC MPD
Reported incidents measure what residents report to MPD, not how safe a place is. This brief pairs them with how enforcement lands in the police district covering Spring Valley.
Key Takeaways
- 9 incidents were reported in Spring Valley in April 2026.
- Theft from Auto was the most common offense (8 incidents, 89% of the month's total).
- Total incidents were down 40% versus March 2026 and up 12% versus April 2025.
- The biggest month-over-month change was Theft (Other), which fell from 8 to 0.
- This April was 22% above the 5-year historical average for the month (~7 incidents).
Monthly Crime Volume, Spring Valley
April Incidents by Year, Spring Valley
Offense Breakdown, Spring Valley
How Policing Lands Here
- MPD District 2 covers about 100% of Spring Valley's reported incidents. 29,525 stops of persons were recorded there since 2023; Black people were stopped at 6.7x their share of the district's population; the district drew 0.7x the stops that its share of reported crime accounts for. Full District 2 analysis →
These figures come from the same MPD stop records and reported-crime data analyzed across this site. Reported crime is not occurred crime, and stop counts measure enforcement, not danger. Methodology: stops by district and enforcement vs reported crime.
Free Monthly Spring Valley Crime Brief
Get a one-page Spring Valley crime brief by email each month: last month's incidents, month-over-month and year-over-year comparisons, and the seasonal trend.
Prefer a one-time download? Download this month's brief (PDF) →
Incident counts reflect reported MPD crimes for the calendar month and are subject to revision. This report shows historical incident counts and trends only.